What Enhancers can tell us about Dependencies
The Core Regulatory Circuitry (CRC) is a set of genes that define cell state and identity by encoding transcription factors. In certain cancers, we have shown CRC to be selective dependencies. We are now elucidating the critical CRC circuitry CTRC in acute myelogenous leukemia (AML). We have shown that BET inhibitors trigger CRC transcriptional collapse in AML cell lines. We have integrated multiple sources of epigenomics data including ChIPSeq, HiC seq, HiChIP, DNase, Degron, WGS, RNAseq and PerturbSeq, to uncover patterns of co-binding that might explain selective AML dependencies. We will present a data integration pipeline and show early results on CRC co-occupancy mapping in AML cell lines. Additionally, we discuss the lessons learned in quality control and bias correction that may prove useful for deep epigenomics analysis.
Intro
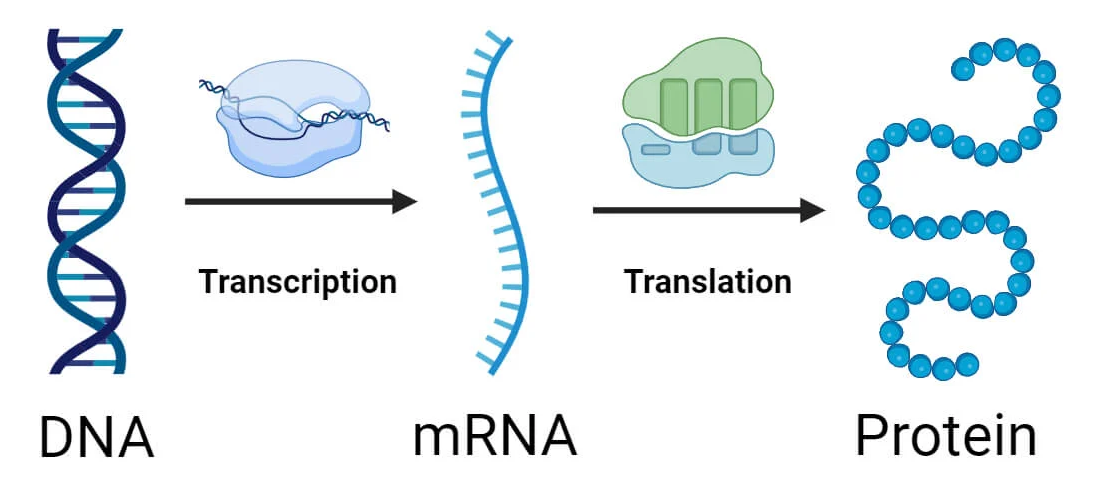
Enhancers are epigenetic features marked by H3K27ac in mostly non-coding regions where transcription factors bind, often as condensate, and recruit transcriptional machinery of the cell to transcribe downstream genes.
Large stretches of enhancers are often called super enhancers (SE), and it is believed that a subset of SE-marked genes constitute the CRC of a cell.
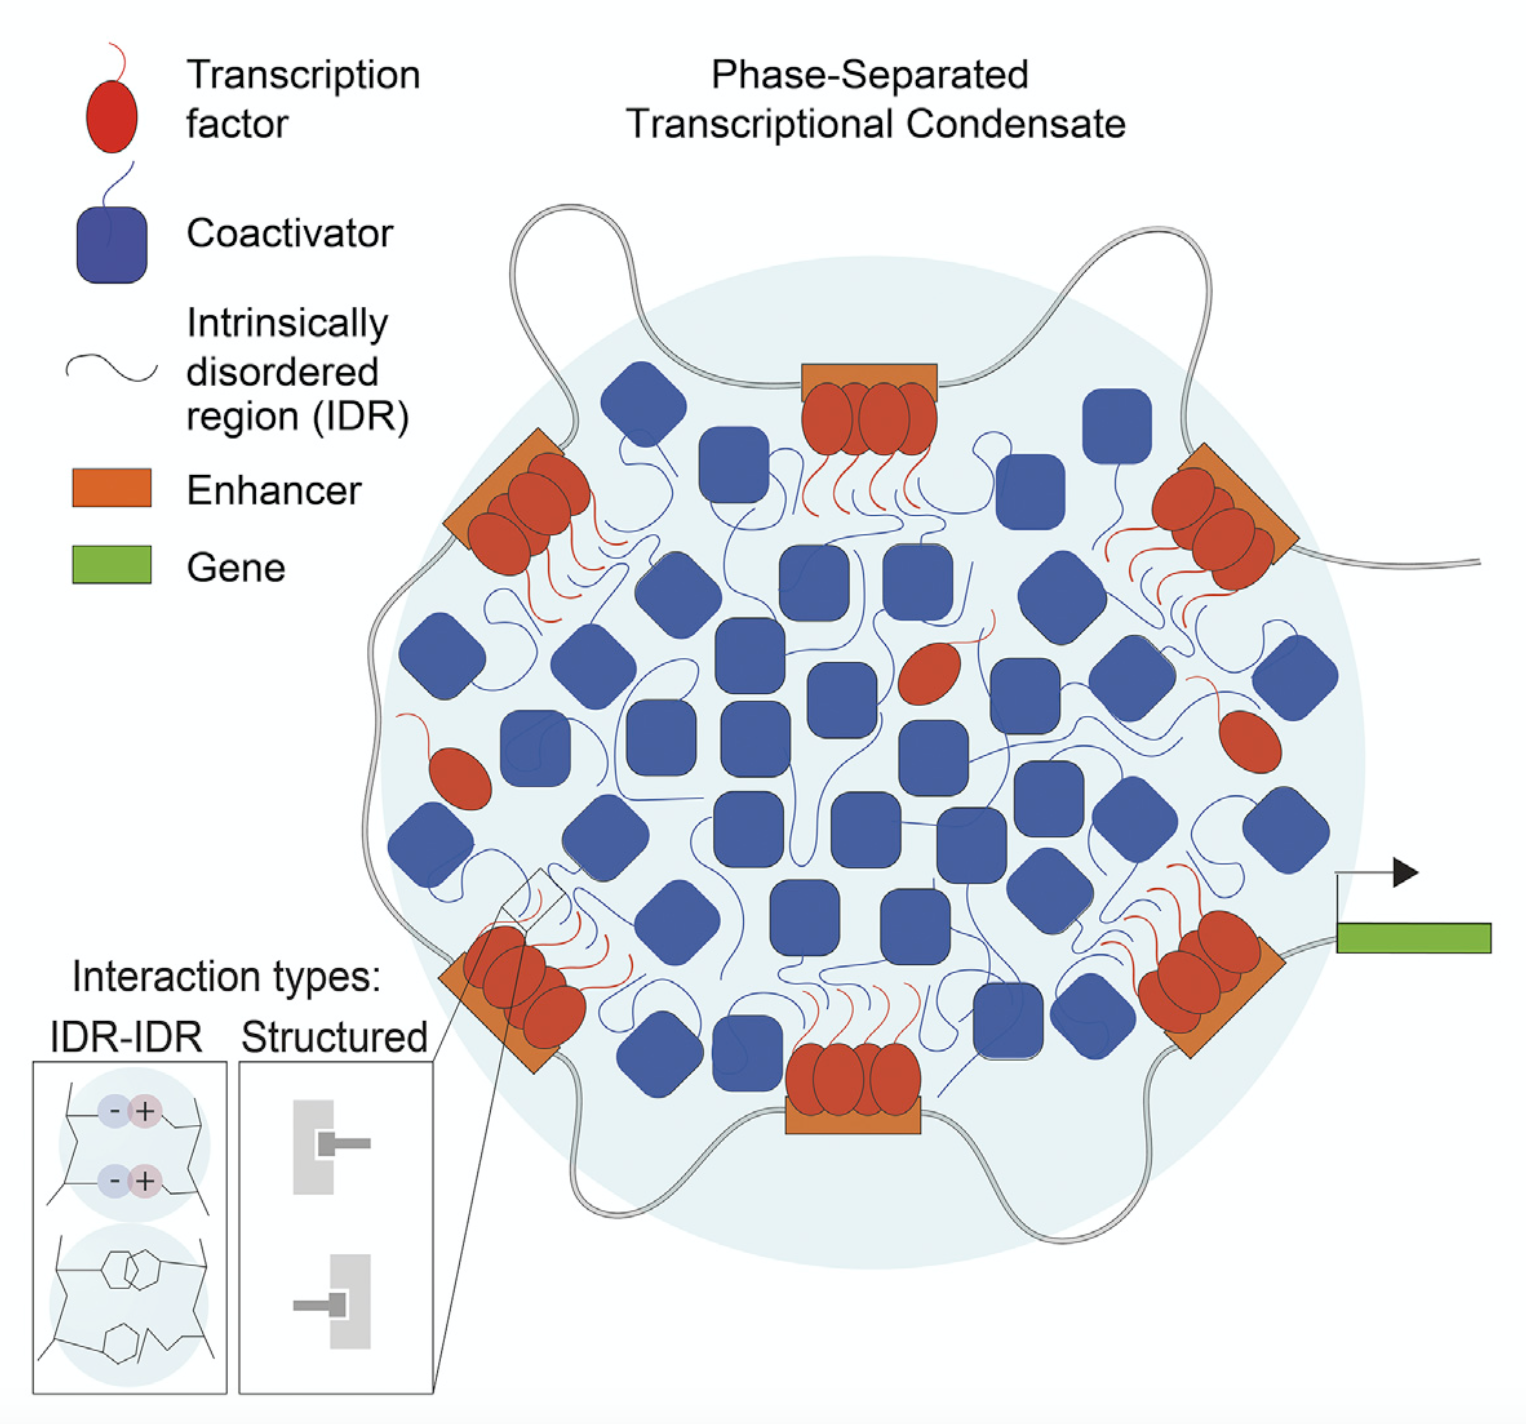
Transcription Factors Activate Genes through the Phase-Separation Capacity of Their Activation Domains, Ann Boija et. al.
The Core Regulatory Circuitry (CRC) is a set of genes that define cell state and identity by encoding transcription factors. These transcription factors autoregulate themselves by binding at their own SEs as well as co-regulate other members of the CRC by binding at their SEs creating an auto-regulatory feedforward loop. They are often driven by important aggregates of Transcription Factors and Mediator.
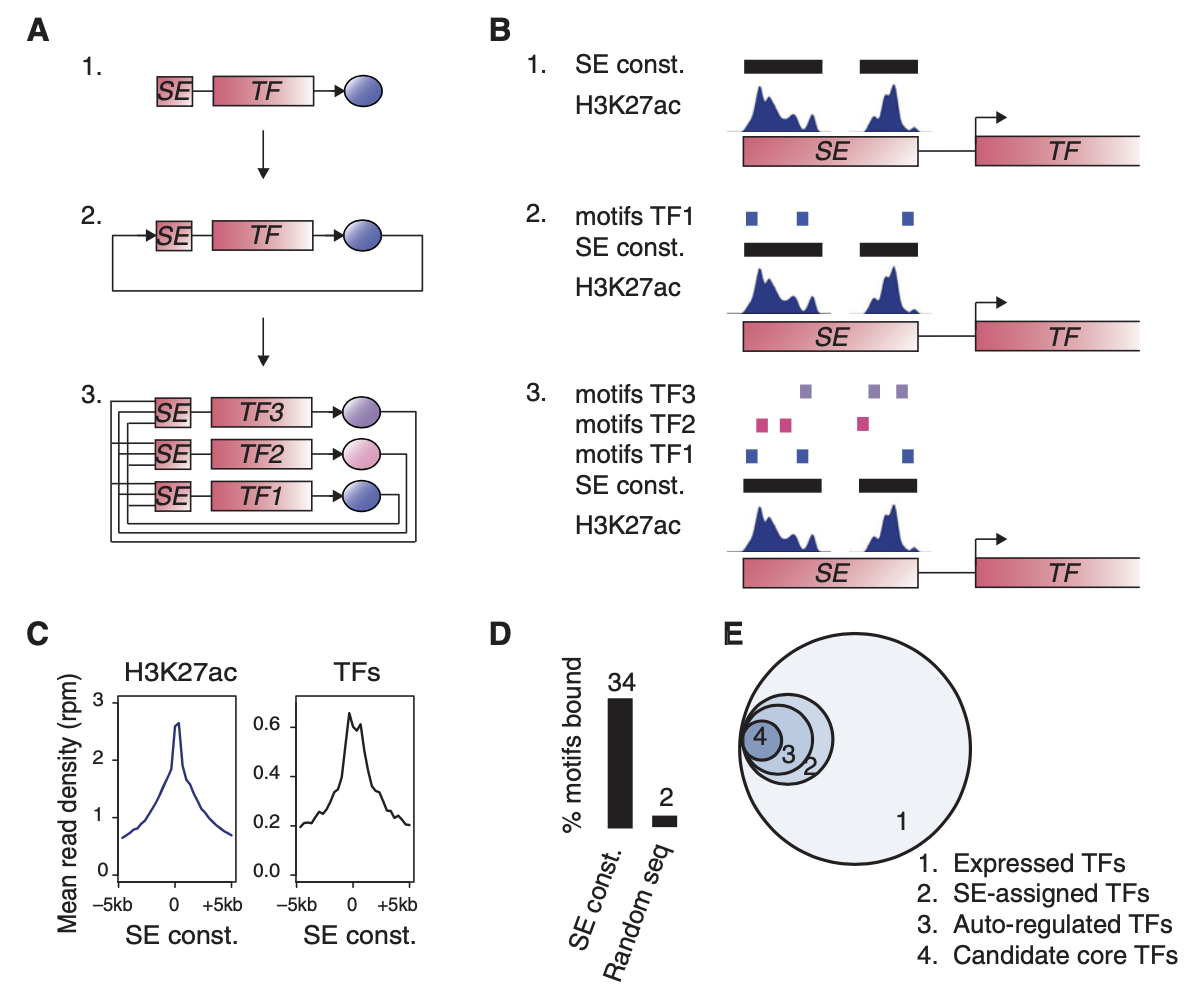
Models of human core transcriptional regulatory circuitries, Young et. al.
These aggregates help create and are found in 3D structures of the genome called Topologically Associated Domains (TAD)s.
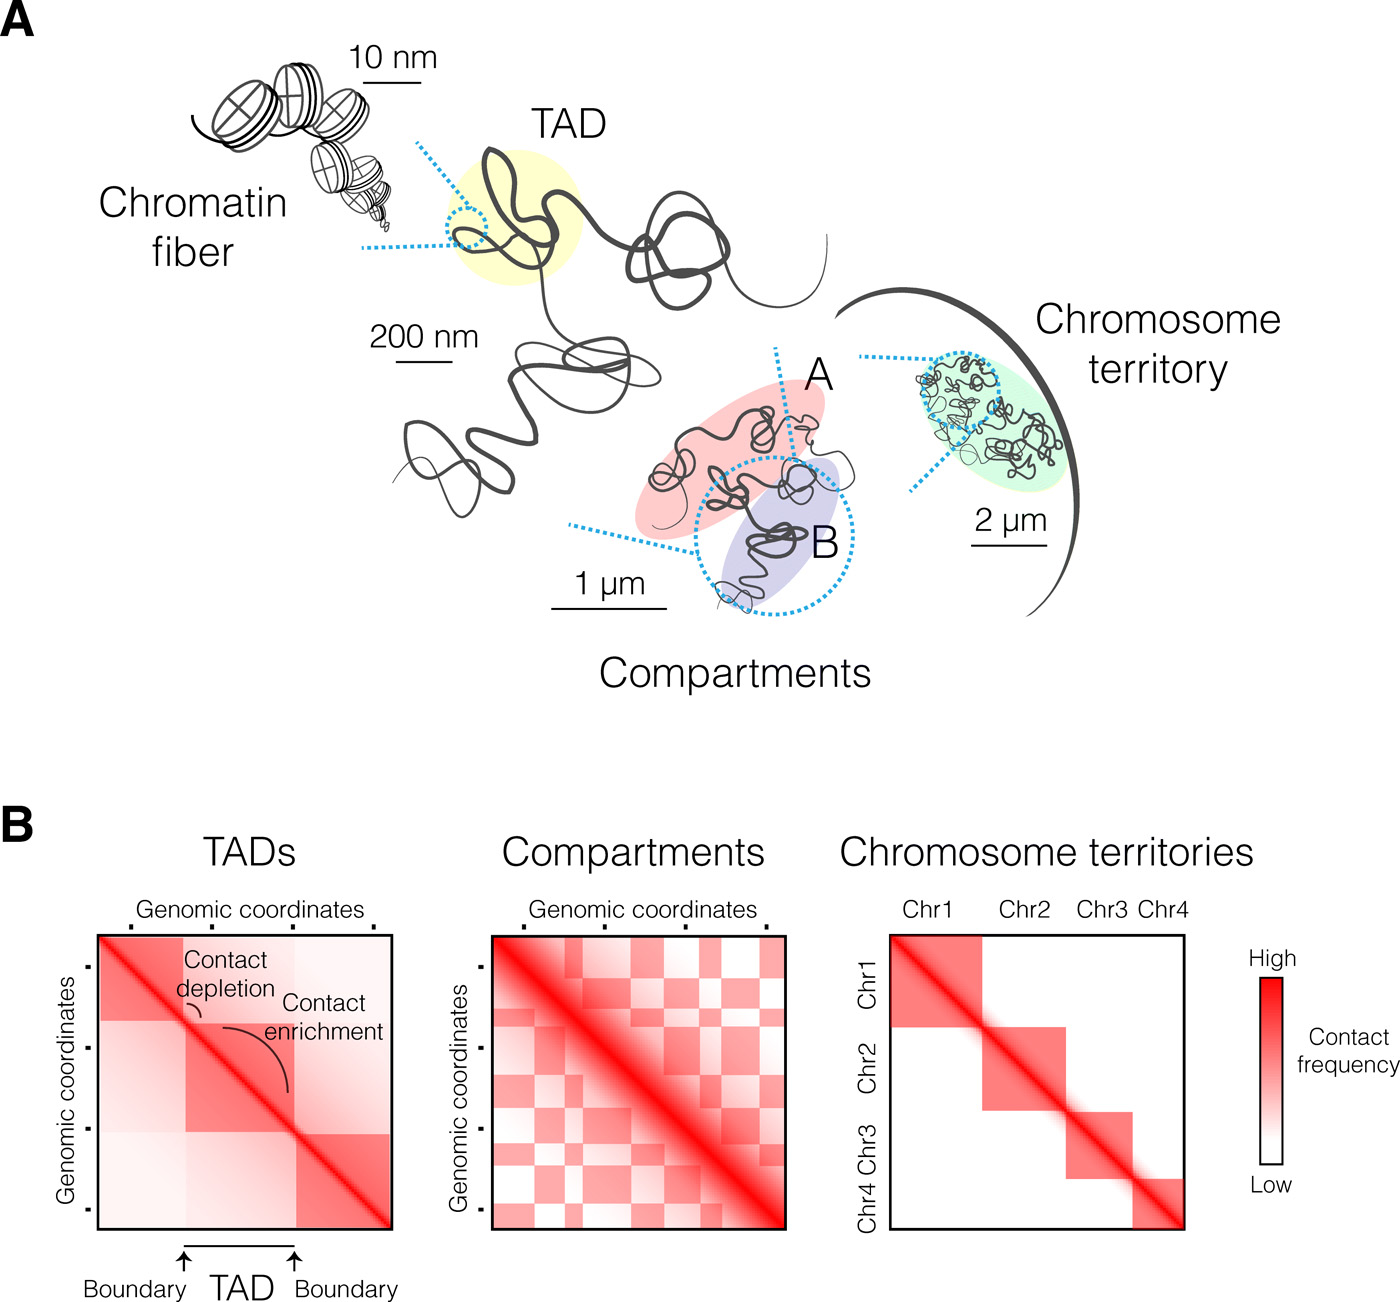
Principles of genome folding into topologically associating domains, szabo et. al.
In certain cancers, like Neuroblastoma drugs that target transcription have been shown to first disrupt the expression of CRC members before triggering transcriptional collapse and cancer cell death. AML is one of the cancer types known to be targetable by such JQ1-like drugs. These drugs, called Drugs called BET inhibitors interact with the bromodomains of BRDx proteins and prevent them from binding to H3k27ac and inhibit transcriptional activation, impacting mainly the expression of MYC.
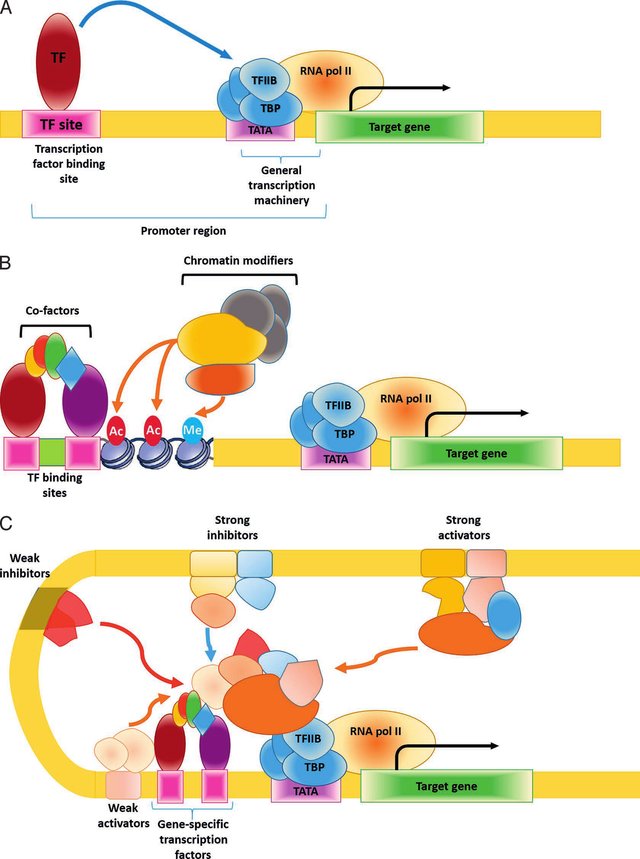
Transcription is a highly complex process subject to numerous modes of regulation. (A) A simplistic view of transcription of a single gene driven by a single transcription factor. (B) A generalized view of the main components involved with regulation of a single gene. The cofactor and chromatin modifiers headings include both positive and negative regulators. (C) A representation of the complexity that can be involved in regulation of a single gene including both cis and trans positive and negative factors. Ac: acetylation; Me: methylation; TF: transcription factor; TBP: TATA-binding protein; RNA pol II: RNA polymerase II; TFIIB: transcription factor IIB, Nam, Reineke
Our goal is to better understand the epigenetic and genetic regulation of transcription by the core regulatory circuitry in AML by integrating a variety of epigenetic data, including H3K27ac, specific TF ChIPs and 3D structure, with genetic dependency data. Here we show the transcriptional responses to small molecules targeting a CTRC member as well as systematic knock-out of the CTRC in AML.
Results
The work was done together with the Orkin Lab from Boston Children’s Hospital and the Stegmaier Lab from the Dana Farber Cancer Institute.
We will be presenting preliminary and unpublished results. We yet have to finalize some of our analysis and create our integrated predictive model.
One of the end goal of this project will be to see what enhancer features will allow us to predict RNA expression. A linear model would then let us know what set of features is the most predictive, how they interact together and figure out why.
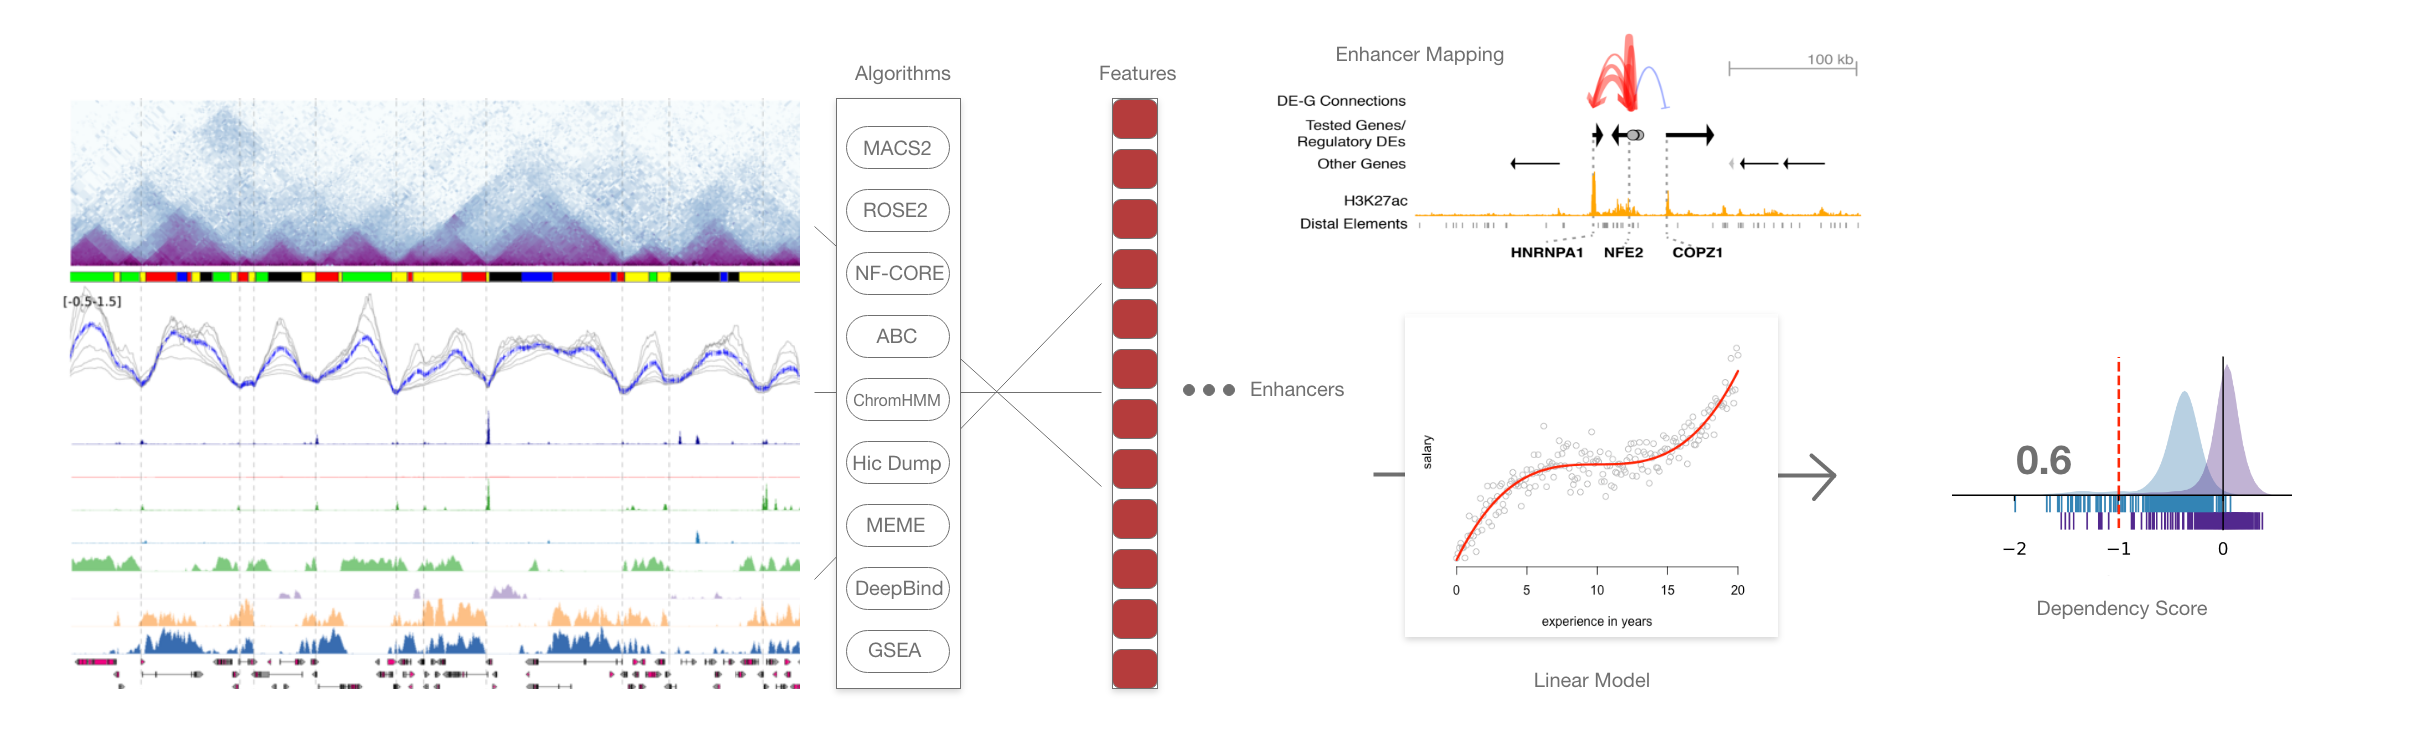
we can see on this that epigenomic data is converted into a set of features accross enhancer regions. The enhancer are then mapped to genes and the set of enhancer*features is then used by the linear model to find back expression of the gene and its essentialness.
Reviewing the processing and analysis
Given the CRC of AML (which we defined here as the super enhancer marked TFs), we were able to manually locate the subset of them being essential in our DepMap screens.
We defined the critical CRC as being enriched (limma, p<0.05) in AML cell lines in Depmap vs all others or as being strong dependencies in Depmap (<-0.5 in at least 2 AML lines).
RNA sequencing under JQ1 analysis
We first received RNAseq samples from different AML Cell Lines under 200um of JQ1 and JQ1+MS2 at 8h and in MS2 at 2, 4, 16 and 24h. The idea was to identify a transcriptional collapse starting with the CTRC and propagating to their target genes. All RNAseq was processed with STAR on Terra according to the CCLE pipeline.
We ran DESeq analysis on it and could not find a reliable signal after 8h as the sequencing depth was kept the same for each sequencing, meaning that we could not see a transcriptional collapse.
However we can clearly see a transcriptional collapse of some of the CTRC members in MS2 after 2 hours and JQ1 after 8 hours. at 16 and 24 hours, the signal disappear. It can be explained by failed experimental procedures, selection of resistant CL or the low number of cells after drug targeting. Both of the drugs would target BRD4 and MYC and it can be clearly seen in the analysis. Interestingly the MEIS1 Homeobox protein is also always up-regulated at these time points.
We could see a downregulation of certain CTRC members This first analysis revealed the difficulty of assessing a global collapse of TF in RNA, especially on a short timescale, leading us to doing a similar analysis using slamseq
slamseq analysis
We undertook a more precise analysis of the transcriptome after drug targeting based on the myc paper (slamseq).
The slamseq procedure will cause RNAs T bases to convert to Cs. We can then sequence them and recover the mRNAs that were translated after the slamseq procedure. If it is applied at the same time as the drug, we can see the direct effect of it on the mRNA translation and have a finer information on the downregulation of genes.
We were able to computationally reproduce their results and are now sequencing our own slamseq experiment.
We were able to computationally reproduce the slamseq paper’s results and are now sequencing our own slamseq experiment.
RNA sequencing after CRISPR RNP experiment
We used RNP induced CRISPR to target CTRC of MV411 and after 72h, RNA sequenced it in triplicate.
However sequencing and targets were made by different groups and found a batch effect. We did not corrected for it (see my soon to be released blog post on why correcting for batch effect -especially in computational biology- is most often not a good idea). We continued our analysis and applied DESeq to the data. We found out some interesting relations and tried to display it in a correlation matrix of each experiment over its differential expression.
This matrix shows set of 6 CTRC that are changing the expression of different targets. We wanted to get more generalizable results and then processed to do a GSEA analysis on biological processes terms and on biological pathways terms. They both gave similar clusters. These were different from the differential expression one and did not contain any of the batch effect relation that we knew about, compared to the differential expression one.
| MYC | BRD4 | MEF2D | CDK6 | IRF2BP2 | ||
| RUNX1 | RUNX2 | ZMYND8 | SPI1 | |||
| GFI1 | FLY1 | MYB | IKZF1 | ELF2 | CEBPa | MEIS1 |
| ZEB2 | ||||||
| LMO2 | MAX | LYL1 | MEF2C |
Moreover, it seems that ZEB2 opposes its regulatory effects to the ones of the first two clusters of regulators. Similarly between the third and fourth cluster were GSEA shows an almost perfectly matching opposition between the two.
We have shown that there is 5 different sub-circuits in the CTRC who regulate and control the expression of a wide range of processes. We have also shown a counter balancing role of the subCTRCs on their targets. This would mean that a stable point is achieved by these subCTRCs in a dynamic way. Using TF knock out + transcriptome profiling we gave an additional basis to the autoregulatory loopings seen on the CRC itself at the TF binding level.
PS: We also developed degrons for IRF2BP2, and will be analyzing also the transcriptional response of MV411 when targeting these TFs at the proteins level. AID degrons are CRISPR modified genes that will allow the transcription of a protein with a degradation tag that will get activated by the presence of Auxin.
CRISPR tilling of some of the enhancer region
We also decided to tile through some super enhancer to see the effect of deletion on the co-binding of TFs. The experiment is still in progress and might give us new insight on how patterns of cobinding are affected by non coding mutations.
The experiment is still in progress and might give us new insight on how patterns of cobinding are affected by non coding mutations.
ChIPseq analysis on AML CL
One of our main experiment is the consistent ChIP profiling of 25 CTRC members. The replicated were first filtered by eye, looking for clearly failed experiments. Given the variable number of replicates and the variable quality amongst replicate and proteins, we decided to first analyze them one by one. Then try to merge the found peaks and look for missed peak across replicates. This would allow us to get a merge quality. Given this quality metric. Either we were often able to discard a failed experiment on the basis of its total number of peaks. Good quality merging were then marked for merging at the bam file level. The merged bam file was then reprocessed. The procedure is named ChIPMerger.
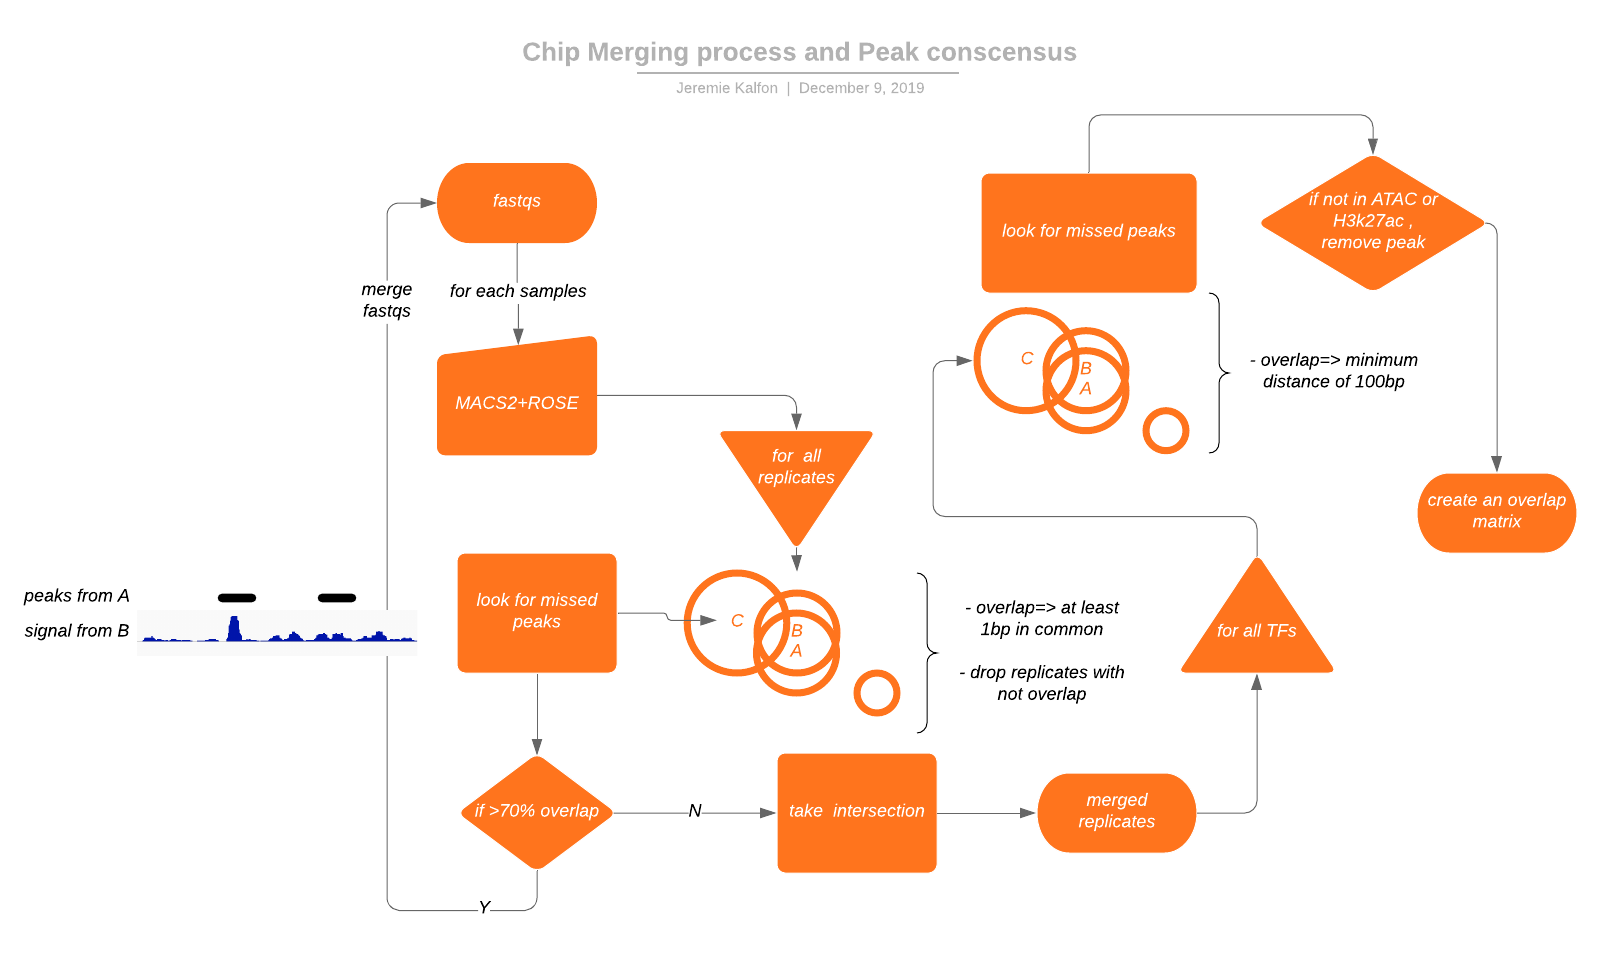
for the set of replicates, we overlap the peaks and try to find whether we can find back unfound peaks by looking at the read coverage for a replicate under peaks found over other replicates. This inform us on the better action (merging bams or taking intersection). We can then create a conscensus peak region by following the same merging process and filtering given h3k27ac and ATACseq data.
The processing tool used was a containerized pipeline and created using nf-core running in batch on google cloud platform (gcp) allowing for scaling and reproducibility of our results. The pipeline outputs quality metrics, macs2 peaks, and bigwig tracks.
We then use our the set of binding profiles to find a consensus set of peaks. We compute back the AUC under each peaks, stitched with ROSE, to get a matrix of TFpresence x samples.
We can see that the correlation matrix obtained on the first 40 PCs that shows some level of cobinding on the consensus peakset.
We are still working on this part of the pipeline so that the consensus peak set is called in a better way: only looking at TP peaks, i.e. only present on H3k27ac, on ATACseq, cobinding only.. and using input when computing the AUC.
Notable cobinding was found between:
| MAX | MED1 | MYC | LMO2 | SMYND |
Which also matched H3k27ac marks. This likely means that these TFs are just present at every transcription sites.
We found that ChIP experiments can be highly variable and have very low quality, needing long and stringent QCing. This led us to the creation of a Pipeline to process and merge panels of ChIPs across a sample. We created a consensus matrix of cobinding profile and found little evidence of clear and insightful cobinding clusters.
NB: some ChIPs were processed with flag proteins (genes that have been modified for their proteins to be easily targeted by specific antibody)
The Model
By building this model we want to understand the amount of information available in AML’s regulatory circuitry to predict its RNA profile and its Dependencies. What dependency type is associated with it and what features are the most with them.
We will now present the general idea behind the model. This is a blueprint of what will be undertaken in the coming months.
We have to emphasize that ChIP binding does not mean a direct regulation to a gene, (neither does it means a direct binding to the DNA sequence). Wether it is up or down regulation of a gene depends on the entire set of regulators in presence and likely how they are placed between one another.
Defining enhancers
We have seen in our ChIP analysis that a clear definition of enhancers will help us discover interesting patterns of co binding. It is also essential for the prediction algorithm. We think that a mix of cobinding, H3K27ac + ATACseq status, ROSE stitching + overlap with known enhancer regions will help us defining clear enhancers.
WIP
Enhancer features
We are planning to create this set of features per enhancers:
- CTRC binding pattern presence
- ChromHMM annotation of chromatin
- CTRC binding values (AUC, peak height)
- mean CTRC binding values for each CTRC group
- RNA expression of bound CTRC
- RNA expression of expected binding from putative CRCmembers (based on CRCmapper)
WIP
Assigning enhancers to genes
To assign enhancer to the genes they would help regulate we decided to use the newly released ABC model instead of the closest expressed genes as it is achieving a much better and biological meaningful mapping. The model has given a mapping accuracy of 70% instead of less than 50% for the closest expressed gene model. We will modify the algorithm so as for it to take any enhancer profile type (even one stretching dozens of kilobases).
The ABC model is based on a prediction of effect of enhancer to genes based on a simple function taking the ATAC profile, H3K27ac marks and HiC association strength. It has been validated by a method called CRISPRi-FlowFISH:
- transduce a library of guide RNAs targeting a set of putative enhancer regions into a population of cells expressing KRAB-dCas9
- induce KRAB-dCas9 expression for 48h
- use fluorescence in situ hybridization (FISH) to quantitatively label single cells according to their expression of an RNA of interest;
- sort labeled cells with fluorescence-activated cell sorting (FACS) into 6 bins based on RNA expression;
- use high- throughput sequencing to determine the abundance of each gRNA in each bin;
- and use this information to infer the effect of each gRNA on RNA expression.
WIP
Mapping expression to enhancer feature
To map expression to enhancer features we want to use a simple linear regression to find out the effect of each feature on the expression. A lack of result in the linear model would hint to a complex interaction between the enhancers and other components of the regulatory complex.
A regression tree would also be learnt. I could better map interaction between components as well as select a subset of them. A lack of results in this model would hint on data quality and or to the other missing factors involved in RNA expression and gene dependency.
WIP
DeepBind and MEME analysis
We also have access to whole genome sequencing (WGS) for a couple of AML Cell Line including MV411. We plan on performing MEME analysis to find TF Binding Sites (TFBS) of the CTRC. The binding patterns already exist for most of the transcription factors but we planned on refining them for AML, using the deepbind algorithm. This model learns the binding patterns based on WGS to predict ChIP binding profile. Full in silico mutation scans of the model then allows to recover the binding patterns most predictive of binding profile.
WIP
Conclusions
We are still processing our data and learning as we go on this complex analysis involving a lot of different data types and different expertises. In addition to learning about better ways to QC and analyze data across groups, technologies and cells.
We envisioned a new regulatory circuit which we call CTCR, that is a CRC refined for elements that are actually essential for the cell function and survival. Our early results showed some patterns of cobinding in the CTRC members. We found out that this auto regulatory circuitry defining the cell identity and state is composed of 5 components that seem to have antagonist (activating/repressing) regulation effect on their targets. This seems to match with the idea of an equilibrium creating a stable transcriptional state.
We found that Bromodomains inhibitors are an example of how the CTRC can be targeted by drugs and other small molecules to trigger a transcriptional collapse through the regulatory circuitry of the cell.
Finally, we have devised a framework to use a wide array of epigenomics features to better understand the wiring of the CTRC and its effect on gene expression and dependencies.
Understanding cancer’s CTRC, might be very insightful in understanding the effect of small molecules targeting some of its components. Being able to decipher sub-circuits influencing specific pathways is a first step toward this goal. In the future the regulatory equilibrium of a cell, could be a seen as a biomarker and target to design therapies.
References
aggregates of Transcription Factors and Mediator
Core Regulatory Circuitry (CRC)
disrupt the expression of CRC members
additionals
Comparing with other’s data
- We have recovered H3k27ac ChIPs and HiChIPs from other labs (GEO: ). They will be correlated them with our own analysis
- We are comparing our slamseq results with the slamseq paper.
WIP


Leave a comment