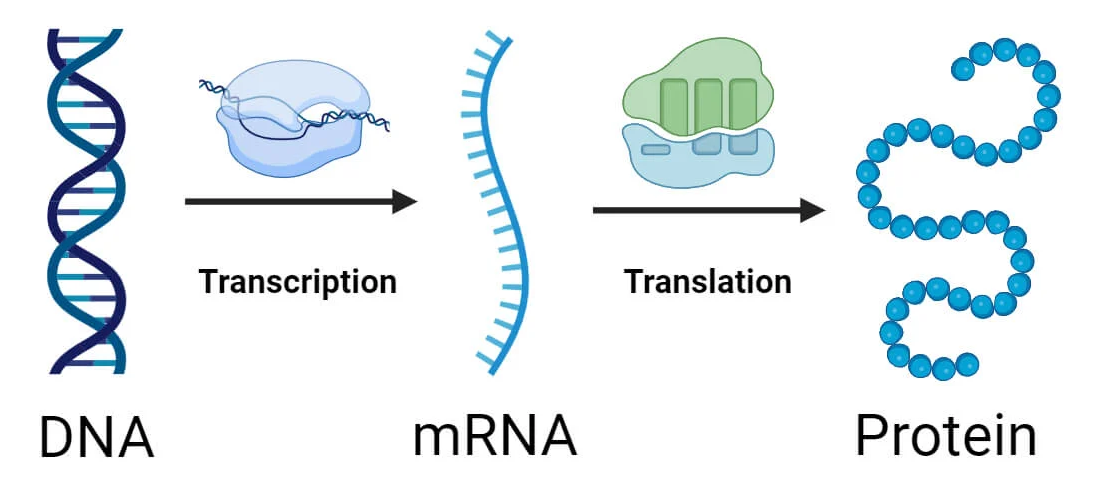
how to work with multiple epigenomic assays on similar samples
Say you are working on a large-scale epigenomics project, receiving ChIPseq, ATACseq and other peak-callable data format. “What happens next? how do you combine them? how do you handle replicates?” ![]()
Although a few tools have been developed for this. They are very rare and uncharacterized compared to DNA-seq & RNA-seq tools.
One of my research focuses while at the Dana-Farber Cancer Institute was to develop a tool to handle this. 💪
Why?
- Because I was working on a project that was receiving hundreds of epigenomic assays, 😱
- with different replicates of different qualities,
- containing many different pull-downs, all across the same cell type.
QC
First of all, the pipeline I used to process these hundreds of ChIPseq samples in a matter of a few hours was the nf-core/ChIPseq with Google Cloud Platform.
Thanks to the nf-core 🙏 community not only did it allow me to process hundreds of samples in a few days, but it was also very complete with tools to assess quality. Using those I then manually labeled the overall reliability of a sample. ✅
CREME
CREME 🍨 is a tool I developed to answer the first question: “How do you combine all these replicates of different quality together?”
- you could do it at the sequencing level, but it seems not ideal. You end up with a huge sequencing file that contains reads that might have been created differently. Moreover, the QC step doesn’t work well, the statistical models used by the peak caller and the mapper are not meant to handle this.
- you could do it at the peak level, but then you need to be clever about the statistics and of how peaks are called, and how you will end up merging those and treating overlaps and so on.
So between hard or wrong, we decided to do it the hard way, at the peak level. I won’t go into the details of CREME but you can learn more about it here: CREME
The TLDR; 📖 is that CREME is a tool that takes as input a list of peaks called by MACS2 for many replicates, and a list of manual quality annotations for all these.

It then uses a statistical model copied from MACS2 to combine the replicates together and output a list of peaks that are more likely to be true positives. It also updates their statistics, signal strength, and size based on the replicates.
Finally, It lets you visualize 👓 the results and update the parameters if need be.
Cobinding matrix
Once you have this merged list of peaks per antibody (e.g. peaks called for H3K27ac, same for MYC, IRF2BP2, etc), you can then focus on the next question: “how do you assemble them to get at the regulatory mechanism and code of the cell?”
What we have built is a cobinding matrix. It is an aggregation over a consensus enhancer region of all the protein peaks and of all the histone marks over the DNA. Over this matrix. one can add models to predict the correlation of TF over elements, association to genes and their expression, etc.
What we discovered is that ATACseq is much more faithful regarding the position of enhancer elements and that it helps remove false positives in our data. Obviously, if a region is not open. it seems unlikely that a TF would be able to bind to it. 🥇
So we actually used a logic where ATACseq serves as a prior for the definition of open regions and K27ac for enhancers. We overlap everything to ATACseq and take it as the reference, so to say.
This actually improved our correlations and downstream predictions. ![]()
Finally, We ended up adding motif analysis with MEME, on a personalized fasta genome of the studied cell line (adding to the reference hg38 FASTA, SNPs, INDELS, SV from our cell line). 🙄
This is actually important because TFs also bind to other TFs and many have non-specific binding to DNA regions. This is the concept of phase-separated transcriptional condensates and TADs papers.
However, these non-specifically bound TFs are actually pretty useless to understand a Gene Regulatory Network. So we used MEME to find motifs in our peaks and then filter out peaks that did not contain the known motif for this TF.
lessons learned: do you even need ChIPseq?
ATACseq can provide you with a lot of information. including TF binding sites. This is called ATAC-seq TF footprinting.
By adding motif analysis what don’t you get compared to ChIPseq? Nothing really ChIP will show you a lot more peaks but they are most likely to be false positives. So you filter them anyway 🤦
So the conclusion was that most likely, these hundreds of ChIPseq assays were not needed… and that a deep ATACseq would have been more than enough. 😓


Leave a comment